You are not sure whether you can afford one more hire this quarter
You find out about a cash gap in the week it happens, not eight weeks before
Two spreadsheets give you three different answers on margin
The month was good. You cannot say which product or channel made it good
An investor asks for a model, and you rebuild it from scratch. Again
None of this is a bookkeeping problem. It is a separate function: tie the numbers of the business into one system that answers three questions. What is happening. Why. What comes next.
What we find
Margin has levers. Usually five or six of them
Not in the abstract. Here is what we found at clients, what we did about it and how it ended.
Discount rate and its size
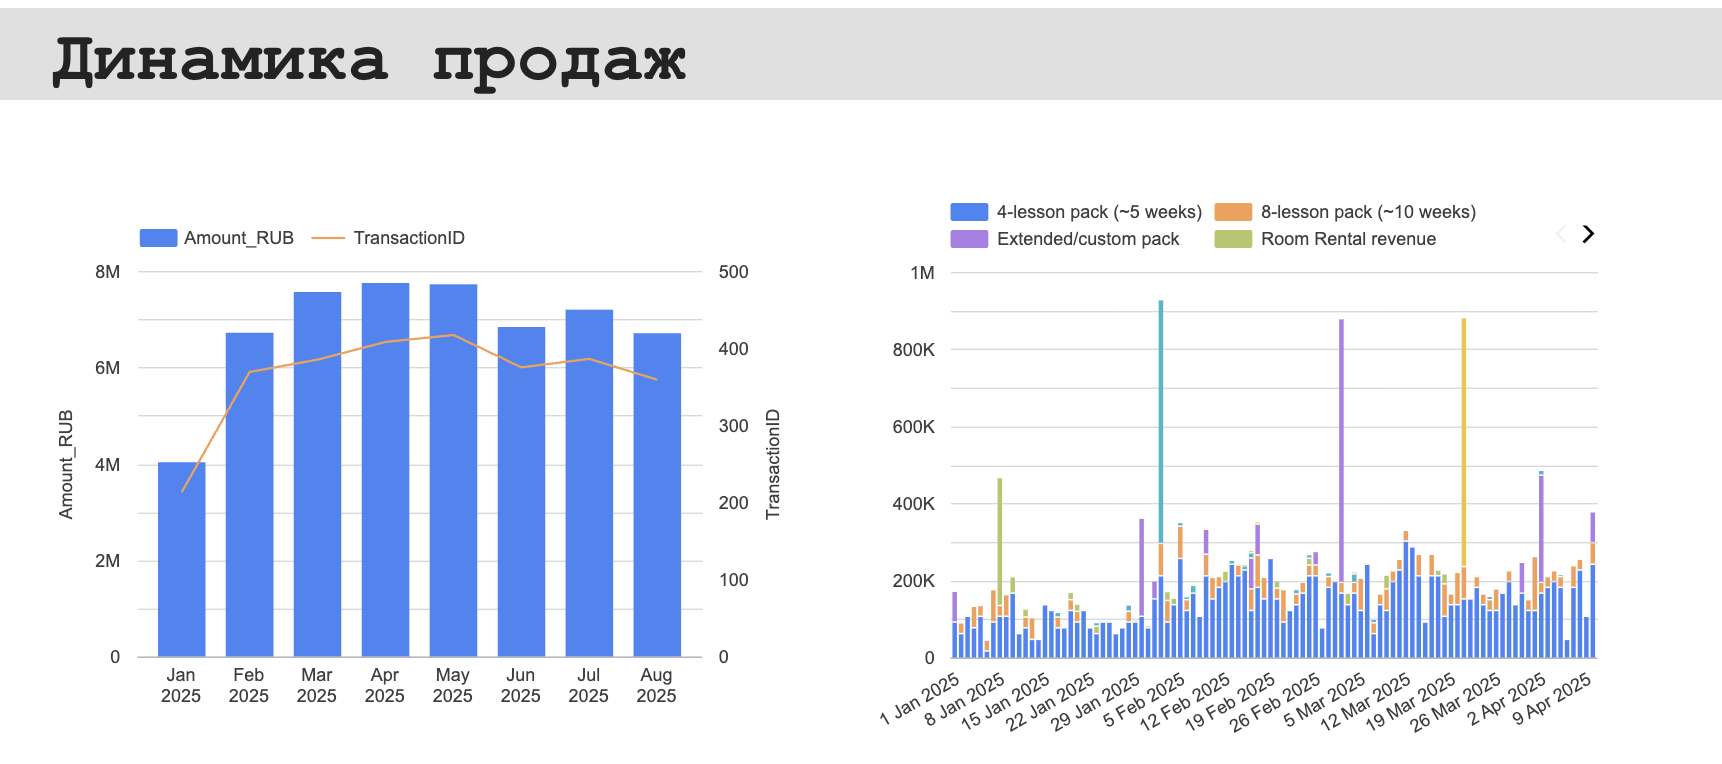
Discounted packages lifted utilisation but took the profit. We set a market ceiling on discounts and a floor price per lesson hour
Vocal school: from an operating loss to roughly +700K ₽ of free cash a month
Pricing tiers
We built cohorts by tier and worked out what each one earns over a customer’s whole life. One tier earned nothing at all: it ate margin and customers did not stay on it
B2C SaaS: that tier was switched off, the line-up rebuilt, +12% ARPPU, −27% CAC
Marketing against cash
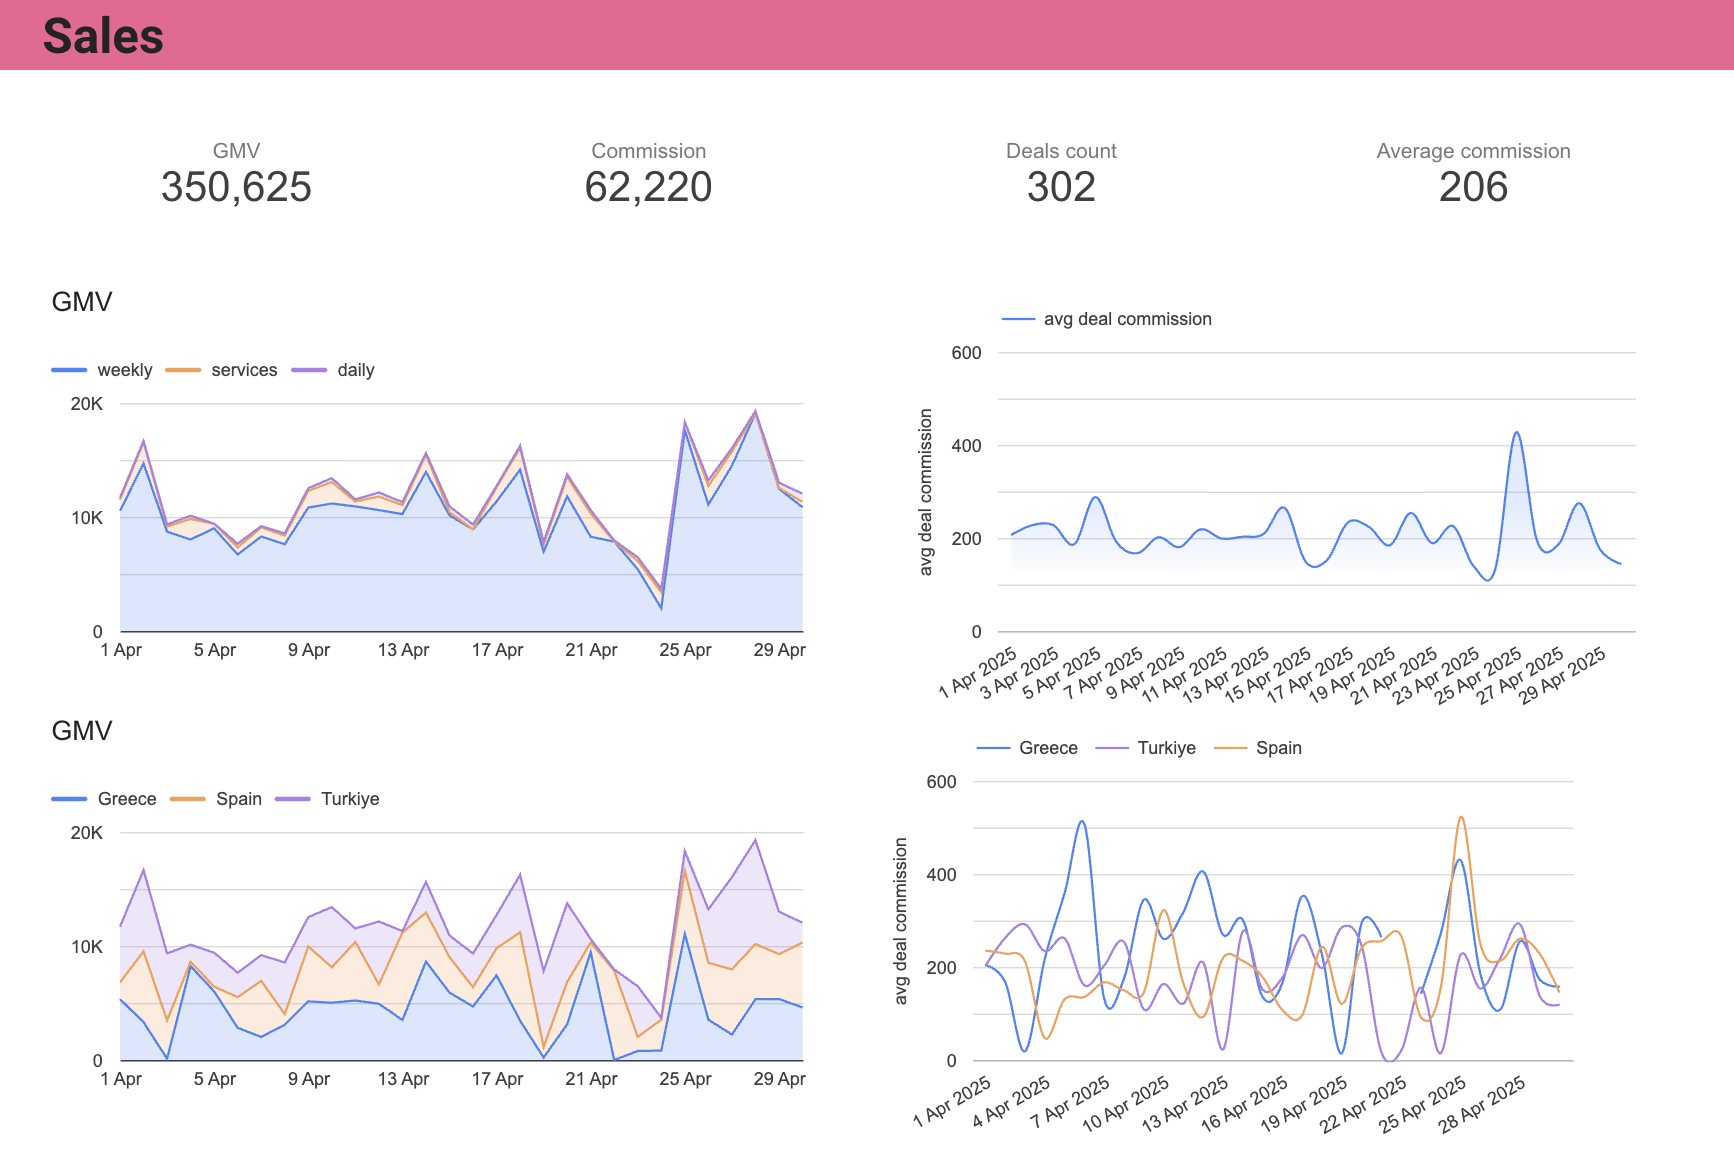
We tied marketing spend to the money in the accounts: spend, leads, bookings and commission in one report
Booking service: cash dips visible 3 to 4 months ahead, driven by lead shortfall in the current cohort
The owner’s time
We removed the manual report assembly: bank and CRM data collect themselves, the report is ready three hours after a deal
Travel: minus 8 hours of routine a week, the founder went off to build the luxury segment, which will be 50% of revenue in 12 months
Accounting is not the result here, it is the instrument. The result is margin that grew.
Businesses we read on sight
We have seen a business built like yours
Every type of business breaks in its own place. It is usually the same place.
Agencies and dev shops
You sell people’s hours. There is no time tracking, so project cost is never calculated, and you cannot see which client brings money and which one eats the team
SaaS and subscriptions
Revenue grows, margin does not. There is usually one plan in the line-up that never pays back acquisition, and you cannot see it until you break it out by cohort
Travel and booking
Client money and company money sit in the same account. The balance looks healthy right up to the day you pay suppliers
E-commerce
You have revenue by channel, but not margin by channel. Ad spend, returns and cost of goods live apart from the cash
Schools, online and offline
Discounted passes lift utilisation and take the profit. Prepaid packages are a liability but look like revenue
Startups from seed
An investor asks for a model and it gets rebuilt from scratch every time. Unit economics do not reconcile with the P&L, burn and runway are estimated by eye
What it gives you
Decisions you can back with numbers
Know exactly how much you can put into growth, and how much you can take out
dividends and growth
Watch your cash balances and see a cash gap coming weeks ahead
8–12 weeks ahead
One source of truth instead of dozens of spreadsheets and chats
one database
Know what earns money and what burns it
by project
Spend your time on new sales and strategy, not on operations
up to 20 h a week
What we do
We work at every level
First, numbers you can trust. Then an understanding of which one is eating the margin. Then the work on those numbers, done with you. Accounting is the instrument here, not the result.
Step 1 · See
Management accounting, implemented
See where money comes from, where it goes, and what is left in the accounts
Pay dividends and fund growth without risking a cash gap
See profitability by project and business line, by week, by month, all time
Plan company spend and cut the risk of running dry
You end up with: one report that shows what you have, what is coming and where it went.
Not a folder of spreadsheets, but the numbers you decide on
We keep what actually moves the money in front of you and strip out the noise. You open it and see where things are fine and where you need to step in.
Company dashboardupdated 4 min ago
Cash on hand…
Low point, 13 weeks…
Below minimum balance…
EBITDA margin…
Cash forecast, next 13 weeks
below minimum balance
Minimum balance $1,200K · monthly payroll with taxes plus a buffer
Revenue, plan versus actual, $M
actualplan
Bars are actual, the dark line is plan. Eight months closed, four to go.
Plan, actual, variance
$ thousands
Plan
Actual
Var
Var %
Unfavourable ← → favourable
The table is wider than the screen · scroll sideways
Every block of data ends with a sentence in plain language. A chart is not something you display, it is something you explain.
The statements underneath it
Consolidated$ thousandsFY, Dec close
Indicator
2023
2024
2025
2026 P
CAGR
Trend
Operating activities
1,893
5,749
9,363
17,852
+111%
Collections from customers
17,940
26,301
34,808
51,204
+42%
Payments to suppliers and staff
(16,047)
(20,552)
(25,445)
(33,352)
+28%
Investing activities
(1,186)
(1,779)
(2,669)
(3,843)
+48%
Equipment and software
(1,186)
(1,779)
(2,669)
(3,843)
+48%
Financing activities
8,196
(6,840)
(8,346)
(11,032)
n/a
Dividends paid
(1,804)
(3,017)
(4,235)
(7,263)
+59%
Loans, net of repayments
10,000
(3,823)
(4,111)
(3,769)
n/a
Net cash flow
8,903
(2,870)
(1,652)
2,977
n/a
Cash, end of period
10,157
7,287
5,635
8,612
(5%)
Takeaway: operating cash more than doubles each year, while dividends and loan repayments pull the balance down. The 2026 plan is the first year both hold and the balance recovers.
Indicator
2023
2024
2025
2026 P
YoY
Trend
Revenue
18,240
26,905
35,447
52,110
+47%
Cost of sales
(9,486)
(13,183)
(14,802)
(20,844)
+41%
Gross profit
8,754
13,722
20,645
31,266
+51%
Gross margin
48.0%
51.0%
58.2%
60.0%
+1.8 pp
Marketing
(3,101)
(4,760)
(6,310)
(9,380)
+49%
Payroll
(5,022)
(6,431)
(8,124)
(11,464)
+41%
Other operating
(1,190)
(1,404)
(1,559)
(2,084)
+34%
EBITDA
(559)
1,127
4,652
8,338
+79%
EBITDA margin
n/a
4.2%
13.1%
16.0%
+2.9 pp
Takeaway: margin expands because gross profit grows faster than payroll and marketing together.
Per customer
Entry
Pro
Annual
Blended
Benchmark
Status
Average check
$29
$96
$780
$168
n/a
Gross margin
38%
51%
58%
47%
≥ 45%
Healthy
CAC
$41
$62
$77
$54
≤ $60
Healthy
Retention, 12 months
34%
58%
81%
61%
≥ 65%
Watch
Monthly churn
8.4%
4.3%
1.7%
3.9%
≤ 3.0%
Fix
LTV
$62
$214
$602
$184
n/a
LTV / CAC
1.5×
3.5×
7.8×
3.4×
≥ 3.0×
Healthy
Payback
9.2 mo
3.8 mo
1.6 mo
4.1 mo
≤ 6 mo
Healthy
Share of new revenue
21%
46%
33%
100%
n/a
Takeaway: the entry plan pays back in nine months and barely clears 1.5×, so it works as an acquisition step, not as a product to scale. The money is in moving those customers to Pro.
What we build on
This is engineering, not a spreadsheet
Xero, QuickBookschart of accounts, auto-categorisation, plan versus actual, client money kept apart from your own
Google Ads, GA4channel spend and leads reconcile against revenue instead of living apart
HubSpot, Pipedrivedeals, pipeline and average ticket land in the same numbers as the cash
PostgreSQL, BigQuerythe warehouse the bank, the CRM and the ad accounts feed into. Reconciliation and enrichment happen there too
Dashboard, Excel, Telegram botthree outputs: drill to a transaction, export it, get the summary on your phone
Stage 01Collect the raw datafrom the primary sources, as it is, with no manual edits
ledgerXero, QuickBooksentries, chart of accounts, bank
marketingGoogle Ads, GA4channel spend, leads
salesHubSpot, Pipedrivedeals, pipeline, average ticket
peopleTimesheetswhere the team’s hours actually go
Stage 02Land it in the warehouseone store instead of five exports
PostgreSQL, BigQueryraw data lands as it is. Nothing is lost and nothing is overwritten, you can always get back to any number
Stage 03Clean it and enrich itthis is where raw becomes managerial
Source reconciliationdiscrepancies are visible, not papered over
One chart of accountsone transaction, one line item, in every report
Allocationsindirect cost spread across products and channels
Metricsmargin, unit economics and cohorts are computed here, not in email
Stage 04Hand it outthe part you use every day
Dashboarddrill down to a single transaction
Excelan export for the bank and the investor
Telegram botowner summary, cash spend only against a photo of the receipt
Forecastcash eight weeks ahead, before the gap happens
We fit the stack to what you already run. The cost of switching products can be higher than the cost of changing the process around them.
We have worked with:
Why clients trust us
We were CFOs on the inside, not consultants on the outside
We know what the choice between growth and cash looks like when you are the one answerable for it
We have worked both sides of the table
120+ deals as an investor, then finance inside companies that raised money themselves. That is why investor packaging gets built from the inside, not off a template
We do the work ourselves
From the chart of accounts to the data pipeline and the dashboard. We do not hand over a methodology and leave the client to implement it
Big-tech experience, applied to your business
Alexander Skurikhin
ex-CFO, IR at Searadar.ai, Legionfarm
$25M+raised and structured in house
120+deals closed, scouting through exits
10 yearshelping IT companies grow
10 years helping IT companies grow through investment and systematic operational control
Built financial management around KPIs and metrics. Raised and structured $25M+ in deals in house
Started out as an investment manager at IIDF, where he closed 120+ deals from scouting through exits
Y Combinator alum, W20
How it works
Four steps, and you know where each one ends
01
Intro call
30 minutes
We work out where your money question actually sits, and whether we are the right people for it
02
Diagnostic
1 week
We look at your data as it is today, and come back with what is missing, what it will take, and what it costs
03
Implementation
4–6 weeks
Accounting structure, data collection, dashboards. It ends with your first month closed properly
04
Running it
monthly
Close, plan versus actual, and a call where the numbers turn into decisions. Or we hand it over to your team
Step 02 · what the paid stage includes
What you get out of the diagnostic
A map of the money. Where it comes from and where it goes, by account and by source, with personal and business money separated
A list of the holes in the books. What does not reconcile, where spending disappears, which numbers you simply cannot get today
A costed plan. What we do, in what order, how long it takes and what it costs
The two or three numbers you are missing. The ones that would change your decisions first
You keep all of it, even if we never work together.
Let’s talk
Thirty minutes. We go through the goals your company has right now and work out where we can help you grow
What you walk away with, even if we never work together: a straight read on which numbers you are missing, and the two or three that would change your decisions first.
Worth a call if
Revenue is past roughly $40K a month and the spreadsheets stopped keeping up
You want decisions made on numbers, not on the last conversation you had
You can give access to the real data, mess included
Not a call if
You need a bookkeeper, payroll or tax filing
You want a one-off spreadsheet and no change to how the company runs
You are looking for a model that confirms a decision you already made
Agencies and dev shops, SaaS and subscription services, travel, e-commerce, schools online and offline, startups from seed onwards. The threshold where the work pays for itself: revenue from $35K a month.
Why does a business need a financial model?
A financial model is used to raise investment, to check whether a project pays back, to work out unit economics, to enter a new market, and to turn strategy into numbers and KPIs
Why does a business need management accounting?
It gives the owner the full picture of operations in real time. Decisions get faster and better grounded, weak spots in processes become visible, and so do the openings for growth
How is this different from other firms?
Individual approach: accounting is built around the owner’s questions and the specifics of the business
Current experience from large technology companies
Support during the rollout and after it
You get access to our bank and CRM. What about confidentiality?
We sign an NDA before the work starts. Where the service allows it, we take read-only access. When the project ends, access is revoked and copies of the exports are deleted at your request. Client figures are never published in the case studies on this site without their consent.
Where is the button to book a call?
We will go through your situation on a video call and work out where we can be useful. Pick a time that suits you: here